My Homelab AI Stack: What Breaks Under Load
Running a 20B model at home across four nodes. 27 load tests, 7,209 requests — the GPU was never the ceiling. Eight config defaults I'd never looked at were.
At 128 concurrent workers, image requests were failing 100% of the time. The RTX 2060 had 1.6 GB of free VRAM. SGLang showed zero queued requests. The hardware was idle and every image request was timing out.
The answer was in how the stack is wired — specifically, that there are two different paths to the same GPU, and that the smaller boxes in front of it have their own queues.
The Stack
Four nodes. One inference engine. Everything eventually routes to SGLang on the main server.
| Node | Hardware | What it runs |
|---|---|---|
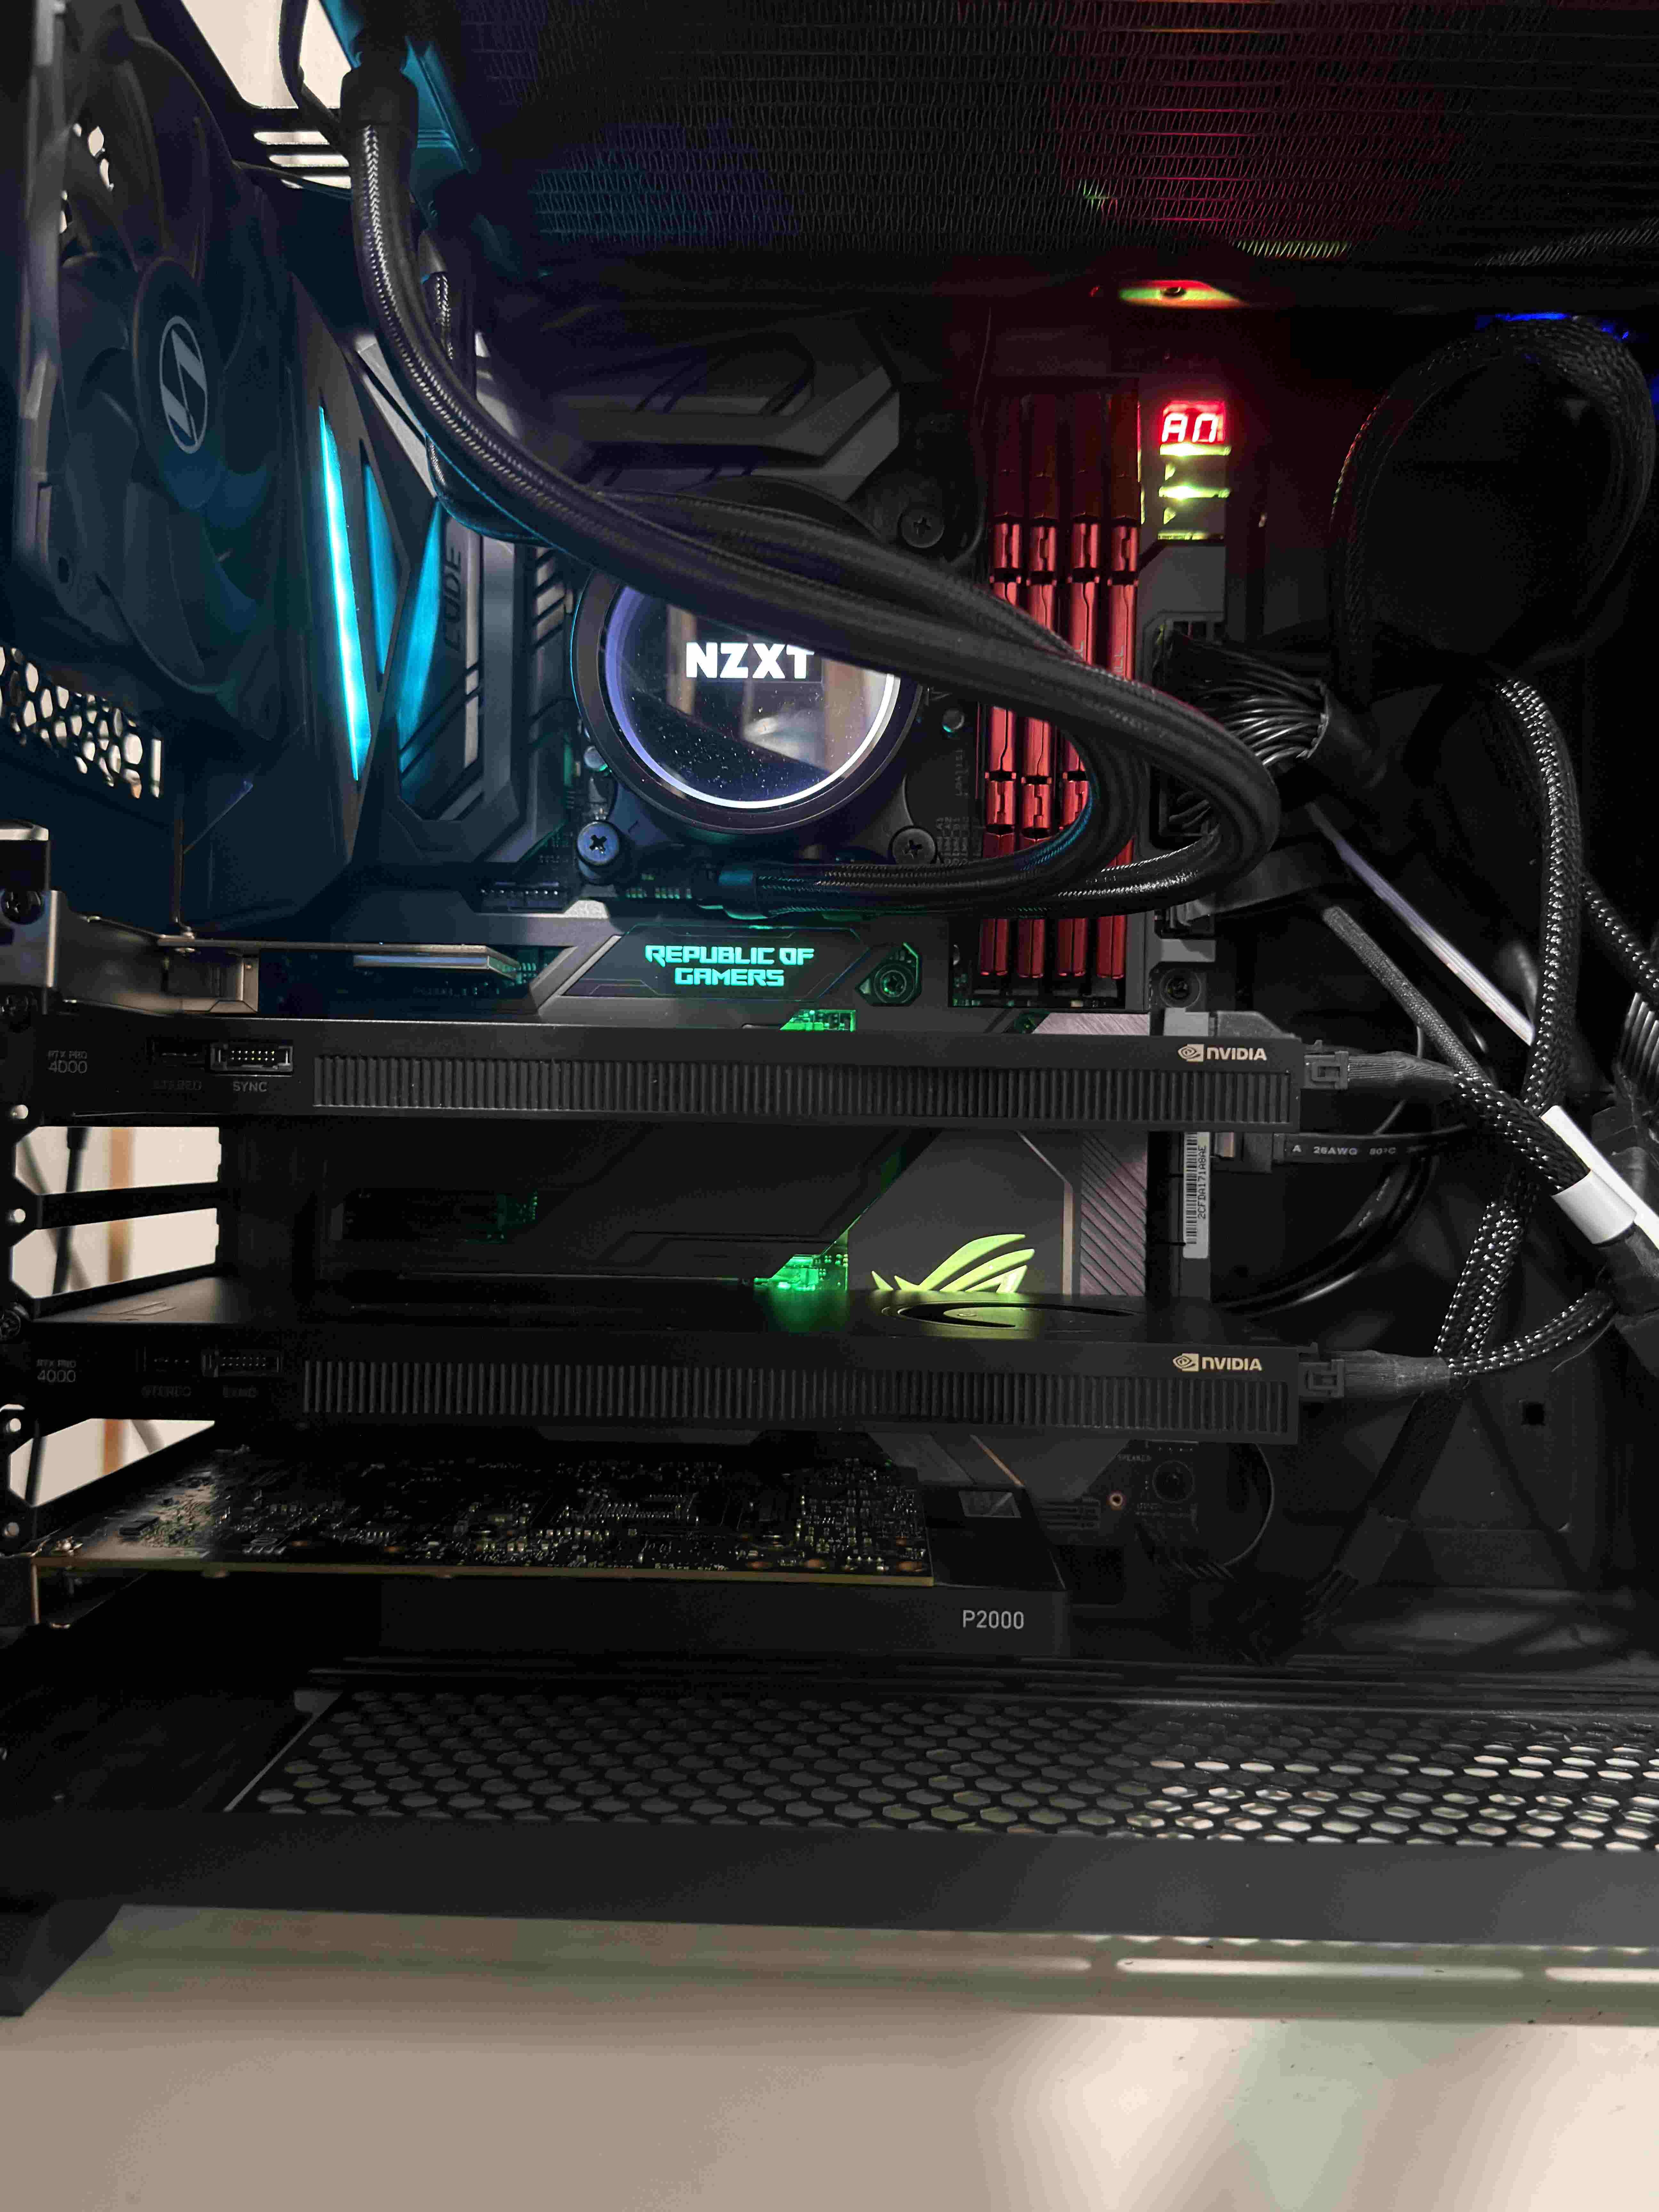
| Main server | 2× RTX 4000 Blackwell · 24 GB VRAM | SGLang · LiteLLM · the assistant · the chat interface |
| Edge GPU | RTX 2060 · 6 GB VRAM | Gemma 4 (vision + text · 4 slots) · Whisper (ASR) · Kokoro (TTS) |
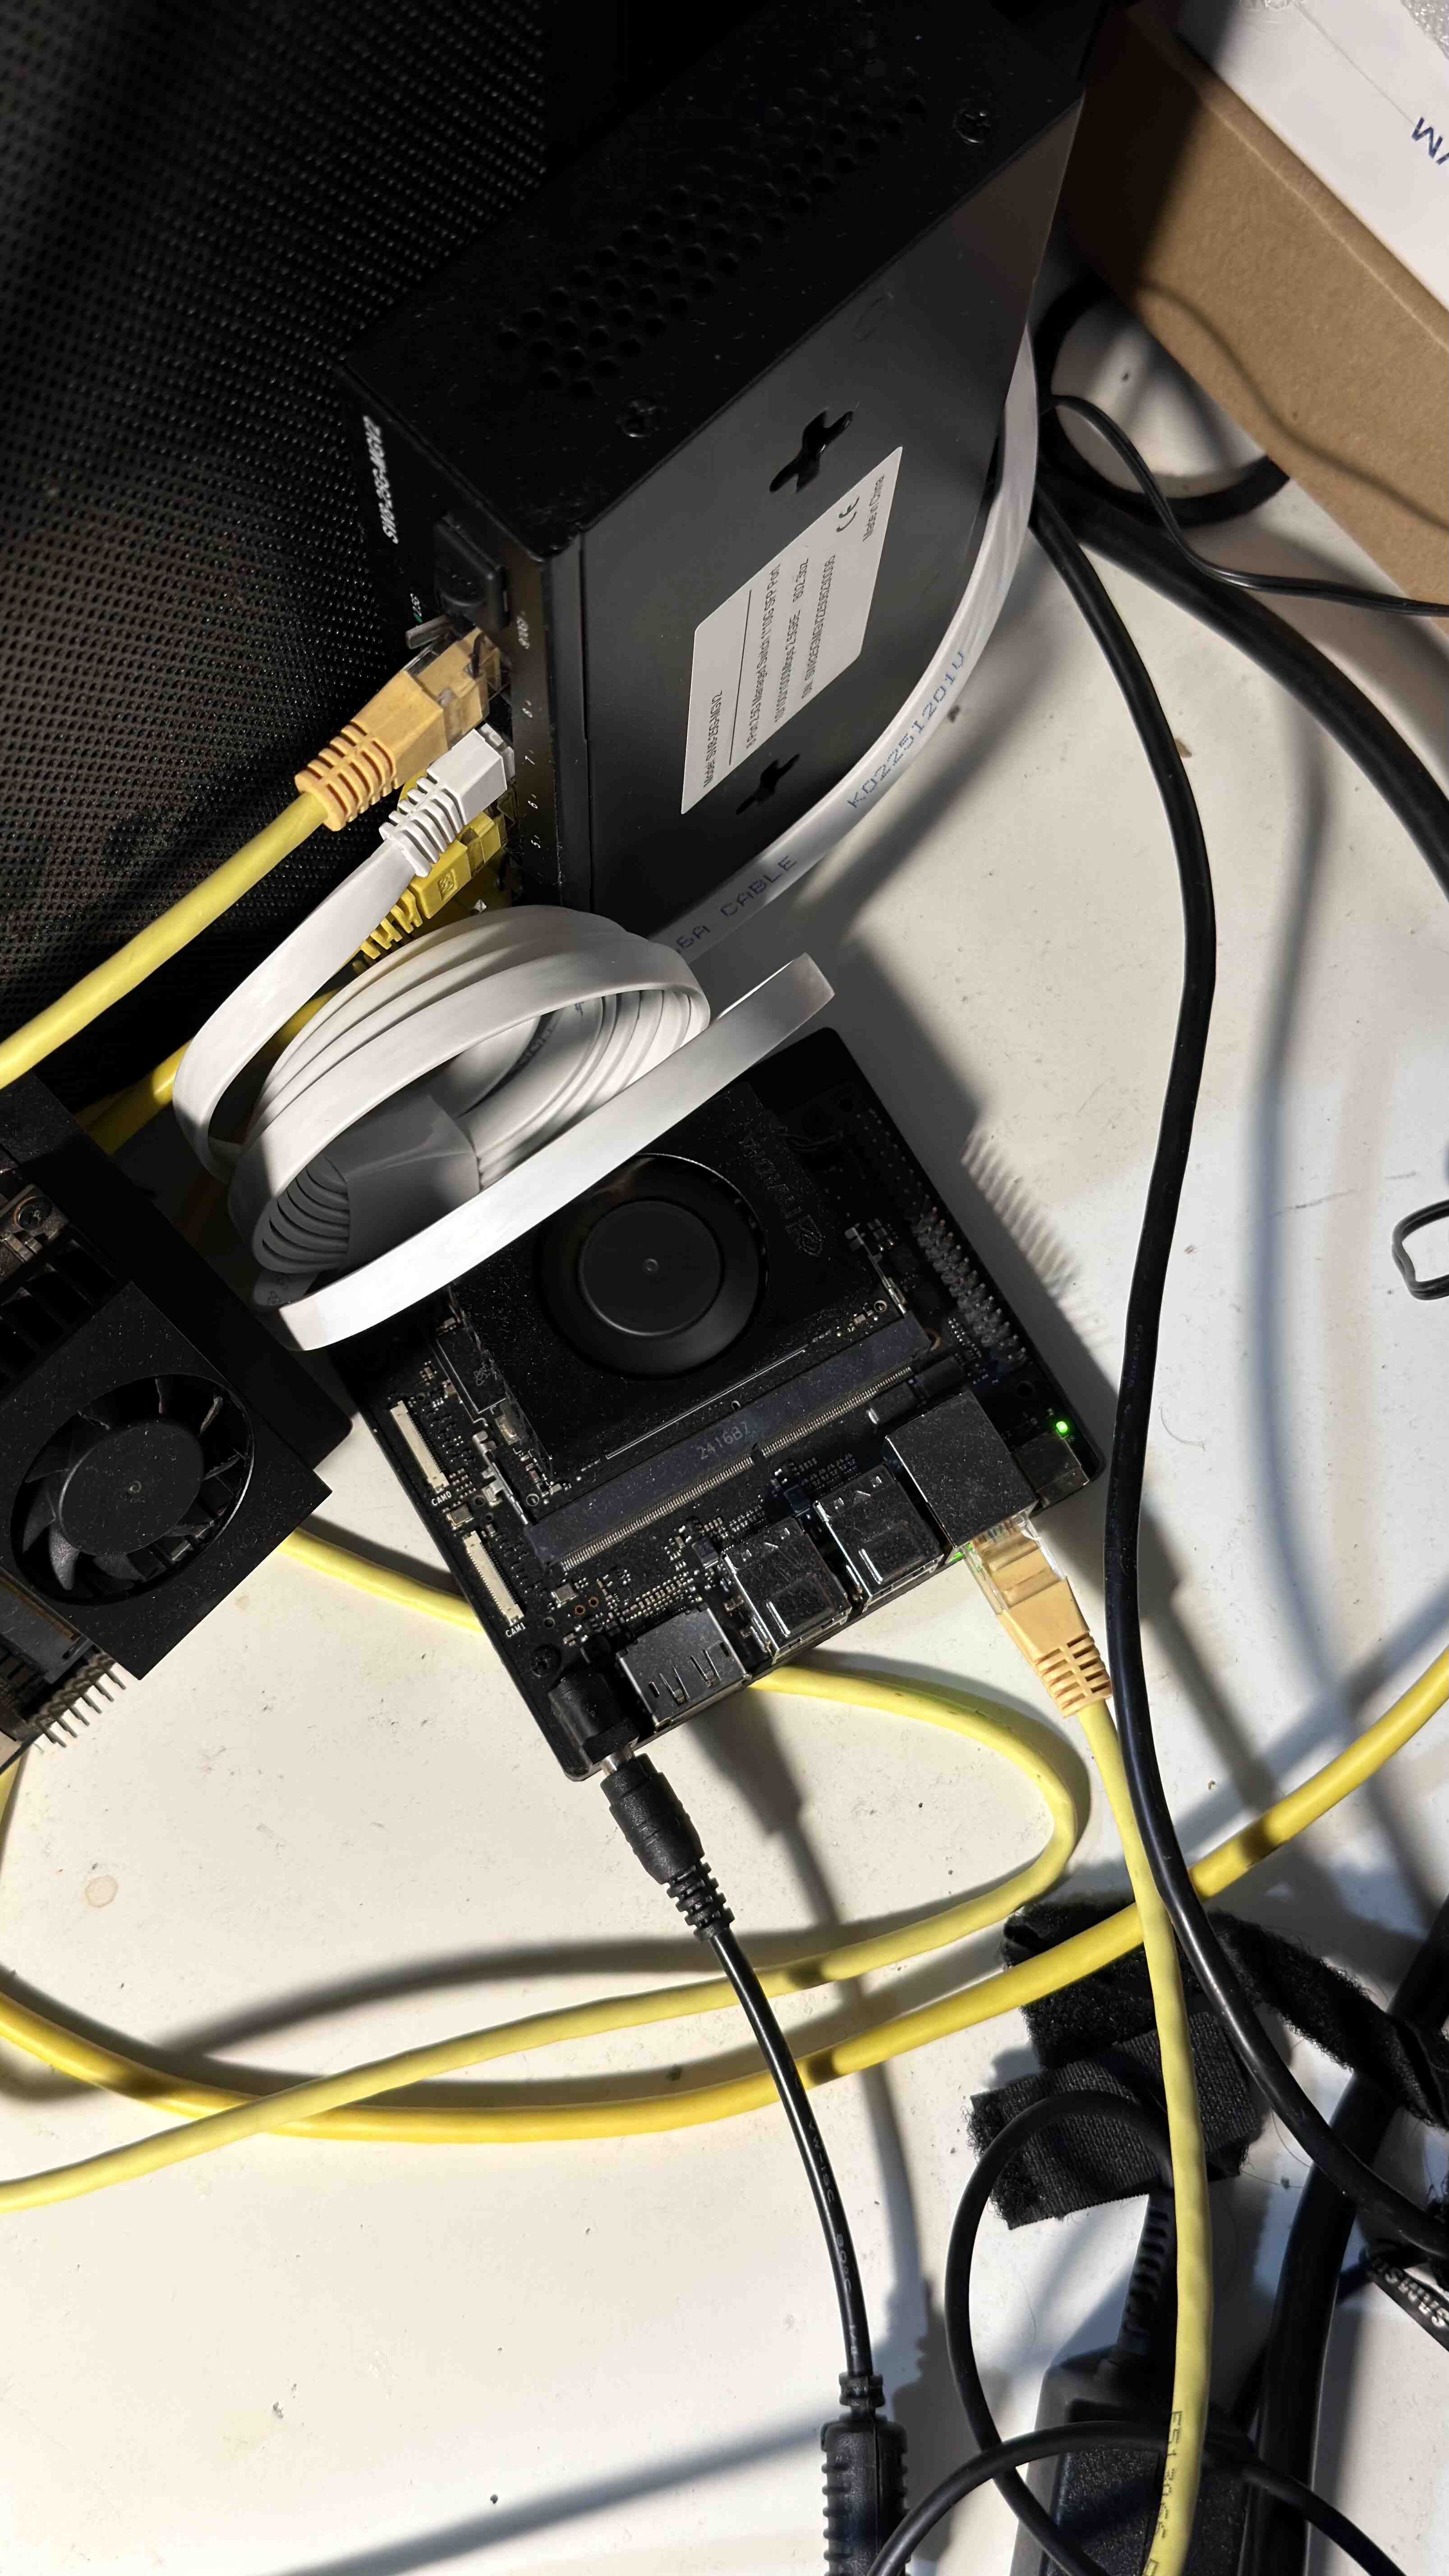
| Jetson Orin Nano | Ampere · 7.6 GB unified RAM | Gemma 4 (vision + text · 8 slots) · NanoOWL detection |
| Jetson NX | Volta · 6.7 GB unified RAM | BGE-base embeddings · cross-encoder rerank · Qdrant · Whisper (CPU fallback) |
I run two things on top of this. The personal assistant — backed by my own notes, retrieves context before generating, runs a full tool loop for every query. And the direct chat interface — no tools, no retrieval, proxy straight to SGLang and return. Same GPU serving both. Different amount of infrastructure between the user and that GPU.
The Orin and the NX traded jobs once during these tests. The Orin is Ampere with CUDA 12 and headroom for 8 parallel Gemma slots. The NX is Volta on JetPack 5 — better suited to retrieval workloads (BGE embeddings, Qdrant, the reranker) than to running a generation model. Putting Gemma on Orin and the retrieval stack on NX matched the hardware to the workload. NanoOWL stayed on Orin because the TensorRT engine is built for that exact GPU architecture.
Two Paths to the Same GPU
This is the structural fact that explains most of what follows.
request arrives
  └── dispatch on (platform × modality)
        │
        │   TEXT
        ├── text, assistant  → tool loop → NX (RAG) → SGLang
        │                                                          quick lookup  7.7s
        │                                                          research     37.4s
        │                                                          deep research 61.7s   [2 queues]
        │
        ├── text, direct     → proxy → SGLang
        │                                      short answer  16.2s
        │                                      medium answer 59.6s
        │                                      long analysis 66.7s              [1 queue]
        │
        │   VOICE
        ├── voice, assistant → Whisper(~1s) → tool loop → SGLang(~75s) → Kokoro(~1s)    77.2s   [2 queues + ASR/TTS]
        ├── voice, direct    → Whisper(~2s) → proxy     → SGLang(~57s) → Kokoro(~2s)    60.4s   [1 queue + ASR/TTS]
        │
        │   IMAGE
        ├── image, assistant → NanoOWL (Orin) → Gemma (eth or Orin)    11.1s   [Orin TRT + Gemma slot]
        ├── image, direct    → Gemma (eth or Orin · 12 slots total)    17.2s   [Gemma slot only]
        │
        │   PDF
        └── pdf, direct      → upload → chunk+embed → SGLang            15.9s   [1 queue]
The assistant path goes through the tool loop connection pool and the SGLang queue — two waiting lines. Direct chat only waits at SGLang. At zero load the difference is small. At 32 concurrent workers it’s the difference between 100% and 59%.
These are the no-load baselines — the floor for every measurement that follows:
| Request type | Entry point | Waiting lines | No-load avg |
|---|---|---|---|
| text — quick lookup | assistant | 2 | 7.7s |
| text — research | assistant | 2 | 37.4s |
| text — deep research | assistant | 2 | 61.7s |
| voice — assistant | assistant | 2 + ASR/TTS | 77.2s |
| image — with detection | assistant | 1 (Orin + Gemma) | 11.1s |
| text — short answer | direct | 1 | 16.2s |
| text — medium answer | direct | 1 | 59.6s |
| text — long analysis | direct | 1 | 66.7s |
| voice — direct | direct | 1 + ASR/TTS | 60.4s |
| image — direct | direct | 0 (Gemma only) | 17.2s |
| PDF upload + query | direct | 1 | 15.9s |
Everything above these numbers is queue wait.
The First Round
Eight tests, 63 minutes, 1,114 requests. Smoke test through full saturation at 64 concurrent workers on the baseline config.
At 16 workers the stack was mostly fine — 107/110. But two types failed in every test that followed them. Long analysis (3,200-token responses) passed 3 out of 5 times because the HTTP client was cutting connections at 120 seconds. The GPU was still generating. The client didn’t wait. Deep research timed out at the tool loop connection pool, not at SGLang.
At 32 workers the two-path split became impossible to miss. Text research dropped from 100% to 59%. Image with detection from 100% to 91%. Voice assistant from 100% to 83%. On the direct path: voice, image, PDF — 100% across all of them. Every failure was a connection timeout at the tool loop. Direct chat never touches it.
A quick lookup takes 7.7 seconds. At 64 workers, it spent 157 seconds waiting in the connection pool before it started. A short direct answer at the same load waited 24 seconds. Same GPU. One extra waiting line.
The long-gen stress test put this in the sharpest terms: long analysis passed 2 out of 14 times at 86% failure. Not because the GPU failed. Because the client gave up at 120 seconds and cancelled jobs the GPU was still running.
Reran with --timeout 300. Same requests, same workers:
| Type | At 120s timeout | At 300s timeout |
|---|---|---|
| text — long analysis | 14% | 95% |
| text — deep research | 0% | 100% |
| text — research | 59% | 100% |
| text — medium answer | 88% | 100% |
Two fixes: raise max_connections to 128 in the HTTP client, raise the timeout to 300s and add proxy_read_timeout 300s in nginx. Two config lines. The same profiles that were at 83% and 72% went to 100% and 95%.
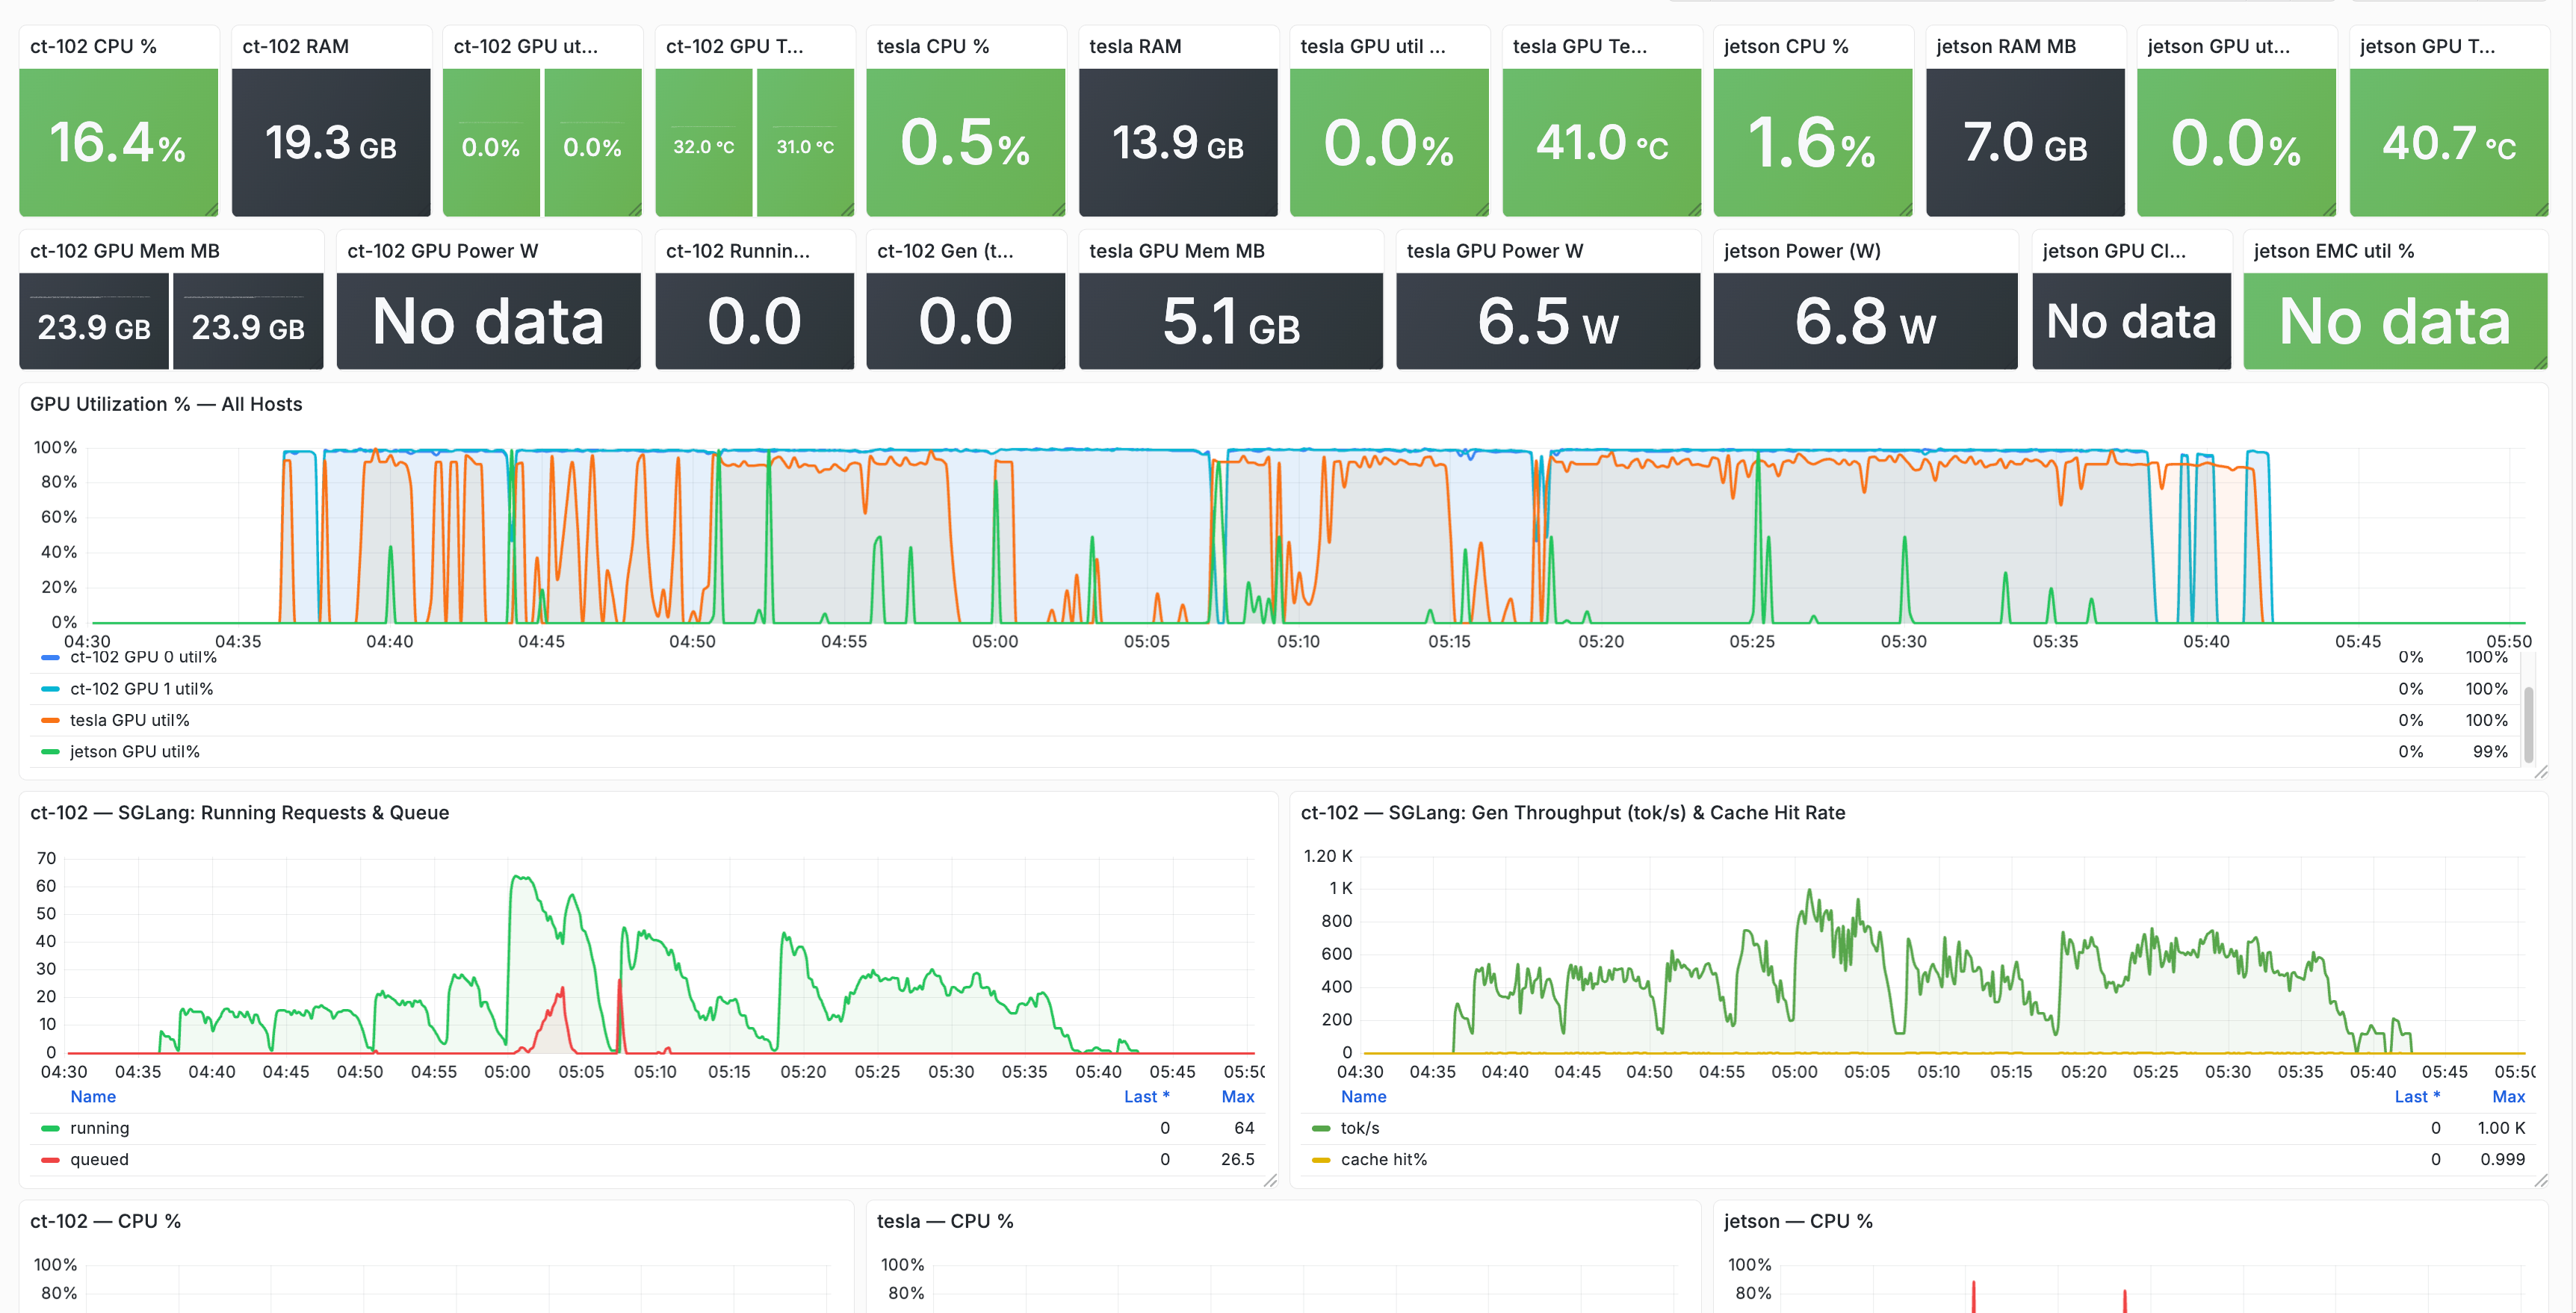
Both GPUs were active the entire time. Token throughput never dropped. Every failure happened in the layers in front of them.
The Sessions Test
Before pushing to 128 workers I ran a sessions test: 64 workers, each running a multi-turn conversation from start to finish. 18 session types ranging from a single quick lookup to a 10-turn PDF research session with history accumulating across every turn.
Result: 219/220 turns. 99.5%.
That’s much better than flat burst mode at the same concurrency, and the reason is worth understanding. In session mode, each worker fires turn 1, waits for it to complete, then fires turn 2. A worker running a 10-turn session is never making more than one request at a time. At 64 workers, the tool loop never sees 64 simultaneous connections — workers are pacing themselves. Sequential turns accidentally solved the concurrency problem that flat burst mode exposed.
Every session type passed, including 8-turn cross-modal sessions and a 10-turn PDF power user with 6,426-token contexts accumulated across turns. The one failure: a 4-turn voice session through the assistant — four sequential requests hitting the same connection pool edge case.
The practical read: the stack handles real user behavior much better than synthetic burst suggests. Real users type, wait, read, reply. They’re not firing 64 simultaneous requests.
Round Two
With the first two fixes applied I pushed to 128 workers. Two new ceilings appeared — both on nodes I hadn’t touched yet.
Open WebUI was running as a single uvicorn worker. Every RAG request — embedding the query, searching Qdrant, reranking results — queued through that one process. Embedding is CPU-bound; async coroutines don’t help when they’re all waiting on the same process. At 64 workers: text RAG at 49%. Bumping to 4 workers in the Docker Compose command override: 75%. One line changed. Voice assistant actually dropped slightly — four workers contending on the same SQLite write lock — but text RAG recovered significantly across the board.
The other ceiling was on the edge GPU. Gemma 4 was loaded with a 131,072-token context window. That consumed 5.2 GB of the 6 GB card. With Whisper and Kokoro also resident: 857 MB free. One inference slot.
| Concurrency | image — direct | image — with detection |
|---|---|---|
| 32 workers | 100% | 100% |
| 64 workers | 47.8% | 46.8% |
| 128 workers | 0% | 0% |
At 32 workers: fine. At 64: roughly half timeout waiting for that one slot. At 128: nothing gets through — every request expires in the queue.
The fix was to drop the context window to a size that actually matched the workload. Gemma caption requests don’t need 131K. Switching the KV cache from fp16 to q4_0 freed another 1.2 GB:
| Config | VRAM used | Free | Parallel slots |
|---|---|---|---|
| fp16 · -c 131,072 | 5,283 MB / 6,144 MB | 857 MB | 1 |
| q4_0 · -c 32,768 · np=4 | 4,301 MB / 6,144 MB | 1,439 MB | 4 (edge GPU) |
That alone cleared the edge GPU bottleneck for typical loads. Per-slot context dropped from 131K to 8K tokens, which still leaves plenty of room for a vision query plus its image tokens.
Applied all four fixes. Ran at 128w / 1,024 requests: 53%. LLM-direct and PDF at 100%. Image and RAG collapsed again — but this time the failure looked different.
Four Gemma slots. VRAM headroom. SGLang queue depth: zero. The usual suspects were clear. I checked the SGLang config: --max-running-requests 64. That’s a hard cap on how many requests SGLang runs simultaneously, regardless of what the hardware can handle. At 128 concurrent workers, the first 64 requests got in. The other 64 queued inside the engine, waiting for a slot to open.
Image requests are fast — 15 seconds each. A long text generation job holds a slot for 150–200 seconds. With 128 workers and only 64 slots, image requests queued behind text jobs and hit the timeout before a slot ever opened. Not waiting for the GPU. Waiting to get in.
Changing --max-running-requests to 128 was one line in the environment file. After that round the failure mode shifted again — to something I hadn’t expected.
Round Three
The first time I tried to bump the edge GPU to more parallel slots — -c 8192 -np 8 — image queries broke entirely. Not slowed. Returned request (4673 tokens) exceeds context size (1024 tokens) and refused to run.
Per-slot context is -c ÷ -np. At -c 8192 -np 8, each slot gets 1,024 tokens. A single image expands into ~1,500–2,000 vision tokens before any prompt or output. The slot is too small to hold the request. The fix is -c 32768 -np 4 — 8K tokens per slot, four slots. Cuts parallelism in half on that box, but vision works.
The Jetson NX had been sitting in the cluster running a small Gemma instance, and it was the wrong place for it. NX is Volta on JetPack 5 — older CUDA, smaller compute envelope. The Orin is Ampere on JetPack R36 with enough headroom for 8 parallel Gemma slots at the same per-slot context. I moved Gemma to Orin and moved the retrieval stack — Qdrant, BGE embeddings, the cross-encoder reranker — onto NX. The hardware-to-workload fit got better in both directions.
That gave me 12 parallel Gemma slots — 4 on the edge GPU plus 8 on the Orin — round-robined through the LiteLLM router. Verified by firing 12 parallel calls. Wall time was 10 seconds against ~42 seconds if they had been serial, with the timing histogram clearly splitting between the faster edge GPU (~3.6s) and the slower Orin (~7.2s).
Three more fixes followed in sequence as I rebuilt the suite on the post-swap stack:
| Layer | Was | Now |
|---|---|---|
| LiteLLM proxy | 1 uvicorn worker | 8 uvicorn workers |
LiteLLM num_retries | 2 (silent retries on near-timeouts amplified queue depth) | 0 |
| Open WebUI | 4 uvicorn workers | 8 uvicorn workers |
LiteLLM at one worker meant every request through the proxy — model routing, hook callbacks, RAG enrichment, LangFuse logging — serialized through one Python event loop. Eight workers is barely a configuration change; the hidden serialization wasn’t visible until the smaller bottlenecks were cleared and traffic actually arrived at the proxy at full rate.
The second suite I ran was a real-world ramp: 128 workers, totals at 128 / 256 / 512 / 1,024, all mixed_realworld profile (production-shaped weighted draw, the same workflow mix you get from real users). Five tests, ~1.5 hours, 1,931 requests.
| Test | Workers | Total | Pass | Avg | p95 | Wall |
|---|---|---|---|---|---|---|
| Smoke | 11 | 11 | 100% | 40s | 70s | ~1m |
| Cold burst | 128 | 128 | 61% | 135s | 233s | 5m |
| Light queue | 128 | 256 | 69% | 143s | 283s | 9m |
| Sustained | 128 | 512 | 84% | 200s | 496s | 22m |
| Long ceiling | 128 | 1,024 | 80% | 214s | 449s | 43m |
Two findings stand out.
The pass rate goes up as load grows, then plateaus. Cold burst 61%, light queue 69%, sustained 84%. The cold-burst run caught the system warming up — LiteLLM workers loading sentence-transformers, Gemma KV caches initializing, the embedding model first-fault. Once warm, throughput stabilized around 0.4 requests per second sustained at 128 in-flight, regardless of total volume. That’s the real ceiling.
Image queries got dramatically faster under load. With 12 Gemma slots active, image-direct went from 117s average at cold burst to 29s average at the long-ceiling test — eight times the load, four times faster. The Orin slots took the load that the edge GPU couldn’t absorb alone.
| Workflow | 128 / 128 | 128 / 256 | 128 / 512 | 128 / 1024 |
|---|---|---|---|---|
| image — direct | 117s | 117s | 41s | 29s |
| image — with detection | 184s | 110s | 52s | 60s |
| text — direct (short/medium) | 52–123s | 96–161s | 171–225s | 181–253s |
| text — RAG (multi-iter) | 67–166s | 142–194s | 220–368s | 205–229s |
| voice — assistant (RAG path) | 195s · 55% | 164s · 21% | 259s · 44% | 161s · 35% |
What’s still failing is the multi-iteration paths — voice with RAG, text with deep RAG. Every iteration is a separate round-trip to the agent server, and each request holds an agent worker for its full duration. 8-iteration deep research × 30 seconds per iteration = 240 seconds occupying one of 16 agent workers. At 128 concurrent workers hitting that pattern, the agent server saturates fast.
Of 200 failures in the long-ceiling test, 185 were timeouts at the agent server (:8090). One was at Open WebUI. None were at LiteLLM, none were at Gemma, none at SGLang. The earlier fixes held. The new ceiling moved one layer up.
Where It Landed
| Test | Workers | Requests | Pass | Wall |
|---|---|---|---|---|
| Smoke | 11 | 11 | 100% | ~80s |
| Uniform — 16w | 16 | 64 | 100% | 252s |
| Multimodal — 32w | 32 | 128 | 100% | 313s |
| Uniform — 64w | 64 | 256 | 93% | 570s |
| Uniform — 128w | 128 | 512 | 67% | 924s |
| Multimodal — 128w | 128 | 256 | 76% | 505s |
| Real-world — 128w | 128 | 1,024 | 80% | 43m |
The image paths tell the story most clearly:
| Route | 1 slot · max_run=64 | 4 slots · max_run=64 | 12 slots · max_run=128 |
|---|---|---|---|
| image — direct | 0% | 6% | 87% |
| image — with detection | 0% | 19% | 100% |
What still fails at 128 workers is multi-iteration RAG. Each request runs 2–8 tool iterations through the agent server, each one a full SGLang round-trip (10–30s). At 128 concurrent requests those round-trips queue at the agent server before reaching SGLang. The GPU is idle. Tool calls are waiting for each other. The fix is more workers on the agent server — or smarter pre-classification that routes simpler queries directly without the full loop.
| Concurrency | All 11 types | Image paths | RAG chains | LLM direct |
|---|---|---|---|---|
| ≤ 32 workers | 100% | 100% | 100% | 100% |
| 64 workers | 93% | 100% | 100% | 100% |
| 128 workers | 80–84% | 87–100% | 35–53% | 100% |
Round Four — the Jetson unified-memory budget
I pushed the ladder past 1,024 requests and the Orin froze three times. Each time looked the same — detection kept answering, the LLM stopped, SSH wouldn’t connect. One of them tipped into a kernel OOM.
The 7.4 GB on the Orin is shared across CPU pages, GPU compute buffers, the llama.cpp KV cache, the NanoOWL TensorRT engine, and the kernel. Every layer was charging the same budget. Three things were wrong.
| Layer | What was wrong | Fix |
|---|---|---|
| Test fixture | One 4K iPhone photo (2160×3840, 25 MB raw RGB after decode) in a random-mix fixture. PIL decoded it on orin and handed the full tensor to TRT — 50–125 MB unified-memory spike per call. | Bound every test image to ≤1280 px on the long side. Max raw RGB went 24.9 MB → 3.7 MB. |
| LiteLLM routing | gemma-2060 (vision) was weighted 4 (eth) / 8 (orin), so ~66% of vision burst landed on orin's gemma + mmproj. Image-direct wedged orin. | Flip to 8 / 1. Eth's RTX 2060 has 6 GB dedicated VRAM separate from system RAM. Orin is overflow only. |
| Eth speech path | Voice·rag had run at ~44% timeout failure across every prior ladder because a single off-the-shelf faster-whisper container serializes inference under burst. | Second whisper instance, both at int8_float16 so two model copies fit in eth's 6 GB VRAM. Agent's existing first-available ASR_BACKEND_URL comma-list does the round-robin. Measured ceiling: ~10 → ~70 concurrent ASR. |
128w × {128, 256, 512, 1024} ladder with all three fixes in:
| Test | Workers / Total | Success | Wall | p95 latency |
|---|---|---|---|---|
| Test-A | 128 / 128 | 126 / 128 (98.4%) | 99s | 96.8s |
| Test-B | 128 / 256 | 256 / 256 (100.0%) | 233s | 209s |
| Test-C | 128 / 512 | 443 / 512 (86.5%) | 600s | 284s |
| Test-D | 128 / 1024 | 947 / 1024 (92.5%) | 1050s | 291s |
| Global | 1772 / 1920 (92.3%) | 33 min | — | |
Per-workflow-type fail rate across the whole 1920-request ramp:
-
image·nanoowl: 0 / 100 (0.0%) -
image·direct: 4 / 202 (2.0%) -
pdf·rag: 0 / 98 (0.0%) -
text·llm·{short, medium, long}: 0 / 581 (0.0%) -
text·rag·{quick, medium, deep}: 2 / 565 (0.4%) -
voice·llm: 71 / 195 (36.4%) -
voice·rag: 71 / 179 (39.7%)
Of the 148 total failures, ~96% are voice — the client times out at 30s waiting for ASR. The two whisper instances on the edge GPU saturate past ~70 concurrent calls, which is where Test-C and Test-D live.
The Engine Itself
Before the stack tests I benchmarked SGLang directly — synthetic load, 256 input / 160 output tokens, no proxy, no tool loop, no routing overhead. Eleven concurrency levels.
| Concurrency | req/s | TTFT p50 | TTFT p95 |
|---|---|---|---|
| c1 | 0.2 | 90 ms | 109 ms |
| c4 | 0.7 | 184 ms | 402 ms |
| c16 | 2.5 | 426 ms | 1.0 s |
| c32 | 3.6 | 613 ms | 1.1 s |
| c64 | 5.9 | 1.5 s | 2.3 s |
| c512 | 6.3 | 6.5 s | 11.6 s |
| c1024 | 6.3 | 6.6 s | 11.9 s |
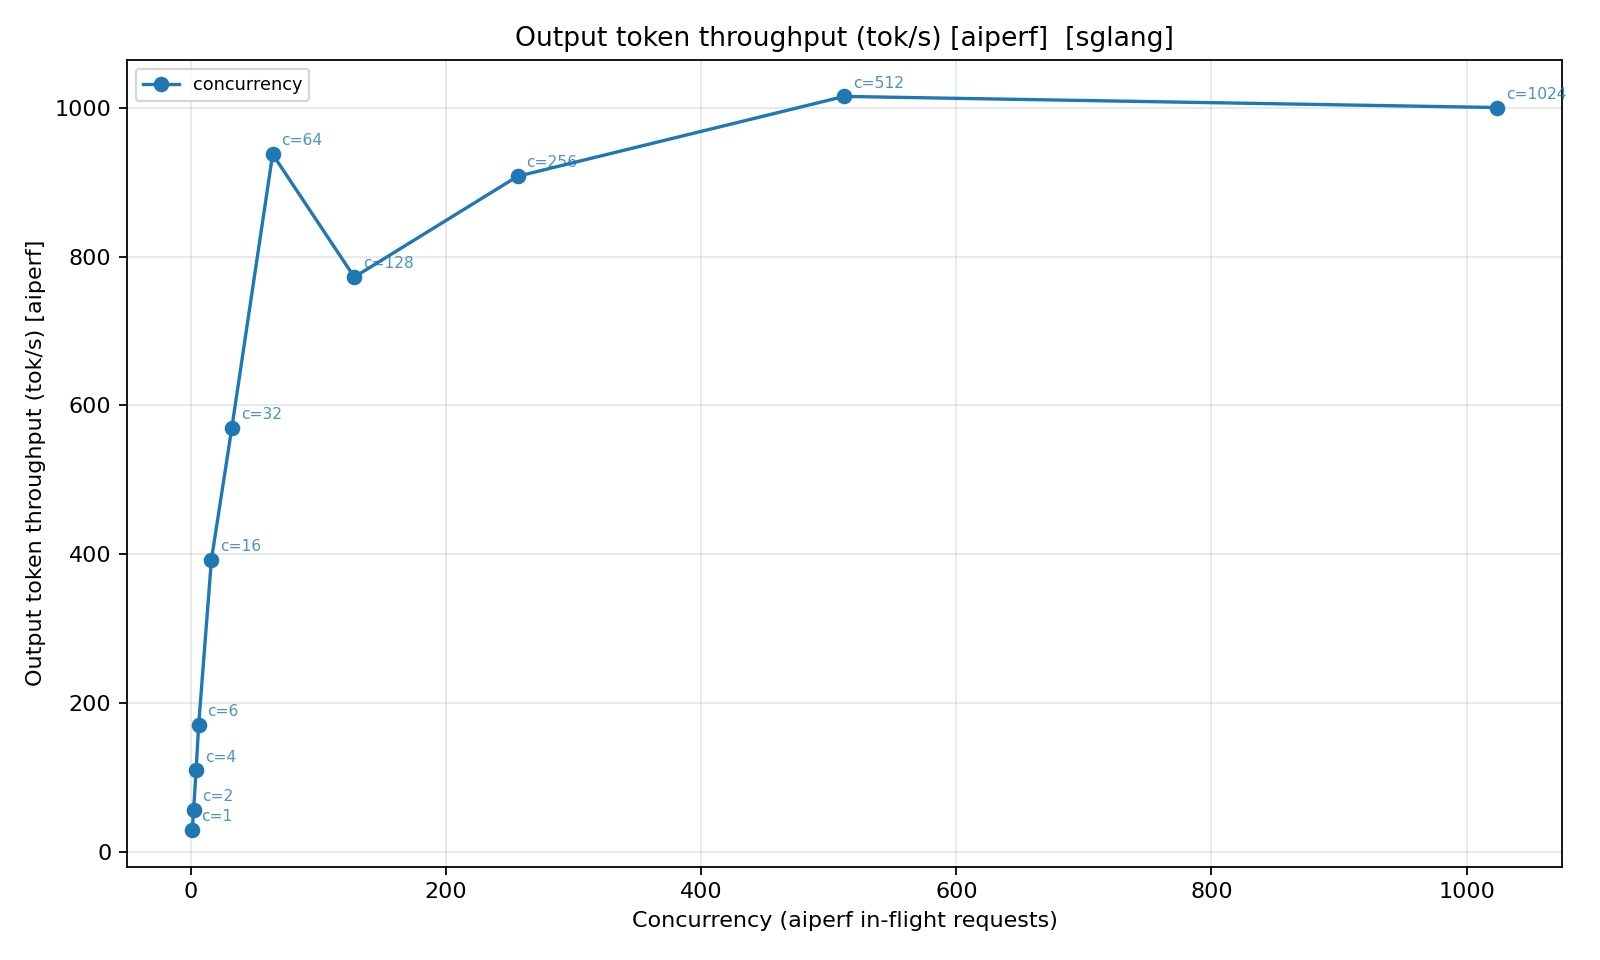
Peak: 6.3 req/s at c512 — 1,016 output tokens per second sustained. The throughput knee is around c64. Above that, request rate plateaus and time-to-first-token climbs.
The 0.4 req/s sustained from the full-stack tests isn’t a contradiction. Homelab requests generate 1,000–3,200 output tokens each, not 160. Multi-iteration RAG holds slots for 200+ seconds per request. Longer outputs and longer tool loops mean longer slot occupancy, fewer completions per second. The engine was handling what it was given.
Across 27 runs and roughly 7,200 total requests, SGLang was never the failure point. Every timeout traced back to a configuration choice made somewhere in front of it.
Source: alphapibeta/model-perf — SGLang concurrency sweep, gpt-oss-20b, 2× RTX 4000 Blackwell.
The assistant is live at alphapibeta.com/llm.